If you've been tracking property rates in Ahmedabad over the last few months, you've probably noticed something: launches are up, rents keep climbing, and the west side of the city is where all the action is. The numbers for April to June 2026 back that up, and they tell a clear story about where the Ahmedabad housing market is headed for the rest of the year.
This report breaks down the latest Ahmedabad residential real estate data: unit launches, capital values, rental trends, submarket performance, and the economic backdrop driving it all.
It's based on the Q2 2026 Cushman & Wakefield Ahmedabad MarketBeat report. Whether you're a first-time homebuyer comparing localities, an investor watching capital appreciation, or just curious about where Ahmedabad property prices are moving, here's what the quarter looked like.
Ahmedabad Real Estate Market at a Glance (Q2 2026)
Indicator | Q2 2026 Figure | YoY Change |
New residential unit launches | 6,143 units | +19% |
H1 2026 total launches | ~12,800 units | +20% |
City-wide weighted average capital value | Up annually | +12% YoY (-6% QoQ) |
City-wide average rental value | Rising steadily | +4% YoY (+2% QoQ) |
Prime CBD capital value | INR 7.9K to 8.6K/sq ft | N/A |
NHB Residex (March 2026) | 107.3 | N/A |
Ahmedabad recorded 6,143 new residential unit launches in Q2 2026, a strong 19% jump compared to the same quarter last year, even though launches dipped 9% from the previous quarter. That sequential dip isn't really a red flag.
The quarter still ran 25% above the three-year quarterly average, and H1 2026 launches together touched nearly 12,800 units, up roughly 20% year-on-year. In plain terms: developers are still confident in Ahmedabad, and supply is coming in faster than it has in years.
West and West Peripheral Submarkets Are Driving the Market
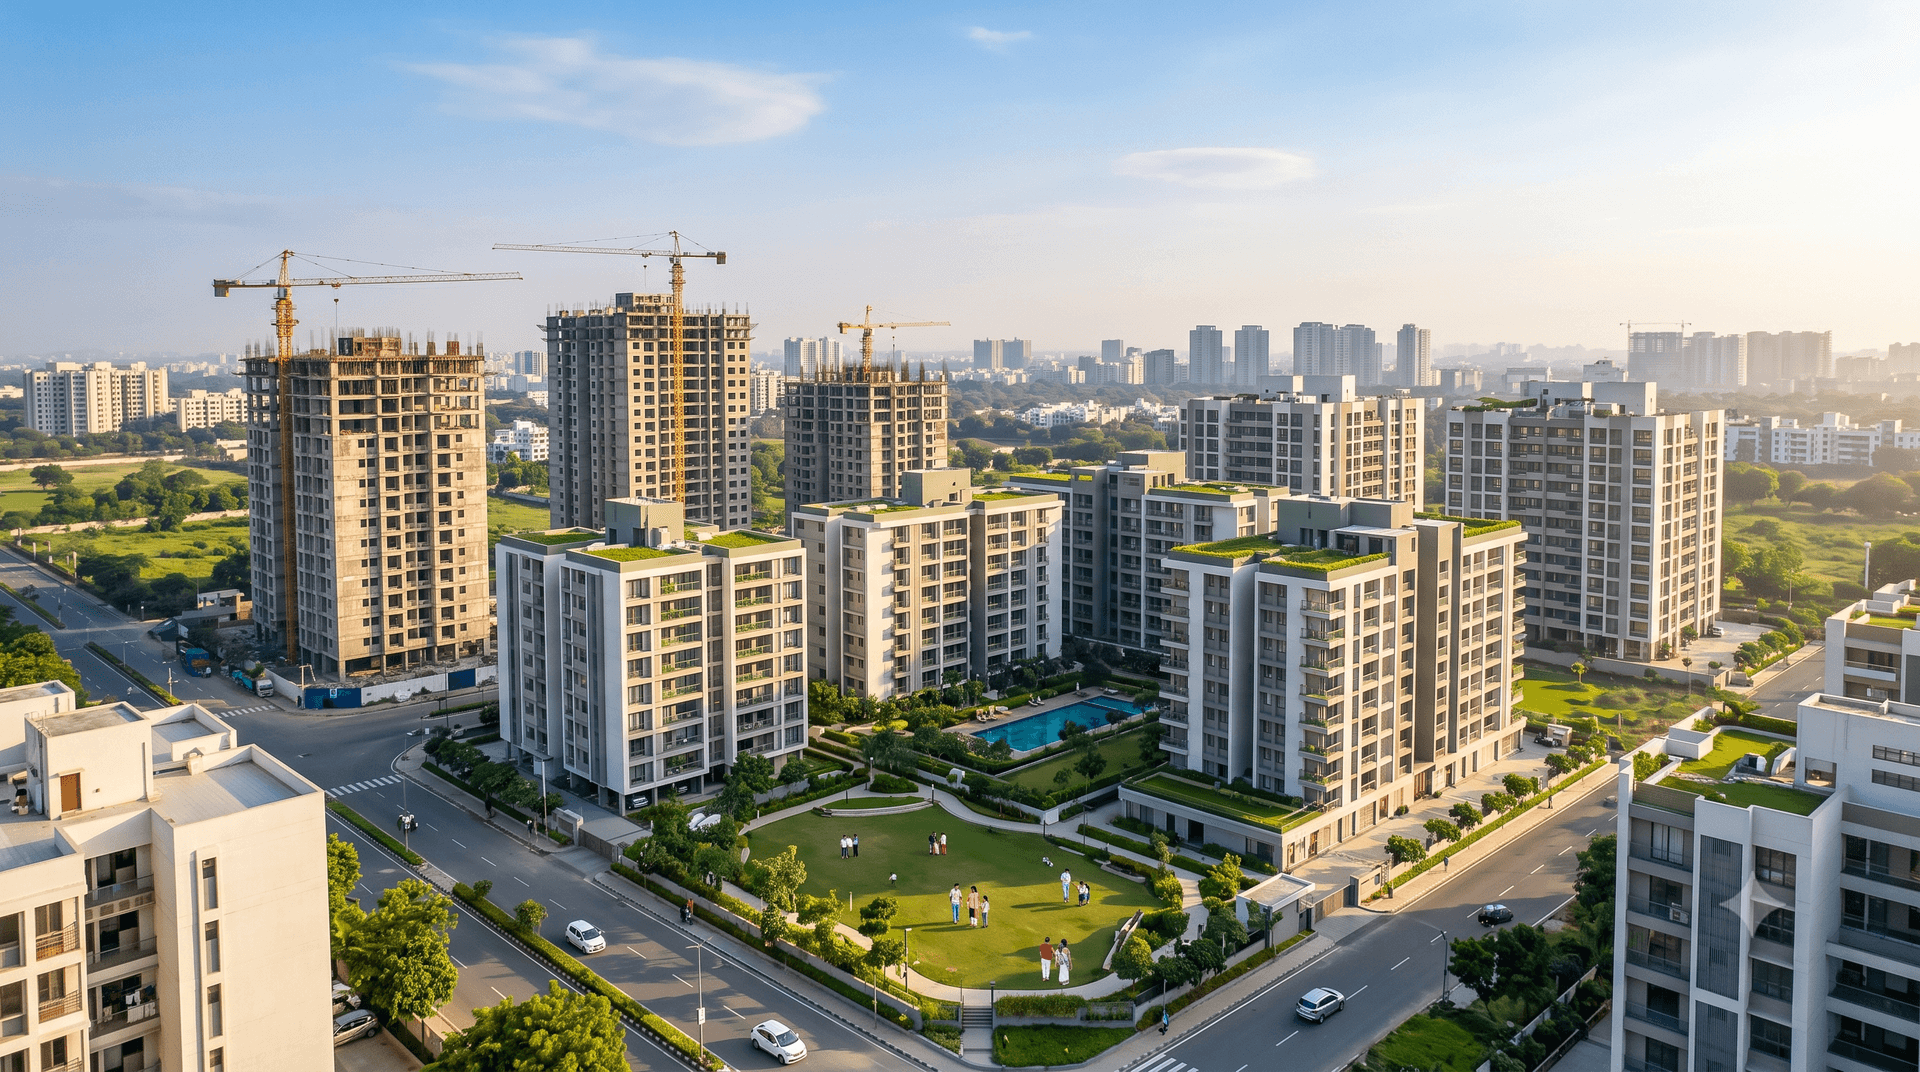
Nearly 40% of all Q2 launches came from the West and West Peripheral corridors: think Shela, South Bopal, Bopal, and Hebatpur. This isn't a new trend; these areas have had land availability and infrastructure momentum for a while, and Q2 2026 simply confirmed the pattern.
Related Blog:
The North Peripheral submarket came in second with an 18% share, concentrated around Tragad, Ognaj, and Gota, areas that continue to benefit from proximity to the GIFT City corridor.
For homebuyers, this matters because it tells you where inventory choice is widest right now. For investors, it signals where developers see the strongest medium-term demand.
Segment-Wise Breakdown: Mid-Segment Still Leads, But Luxury Is Surging
Mid-segment housing held the largest share of launches at 36%, even though it fell 35% quarter-on-quarter and 29% year-on-year, a natural correction after a very active previous stretch.
Affordable housing captured 31% of launches, recovering well after a slower previous quarter.
High-end luxury housing together made up about 33% of the launches. This is the standout number of the quarter. The segment recorded 4x annual growth, concentrated in the West Peripheral (55%) and West (19%) submarkets. That's a meaningful shift in buyer's appetite toward higher ticket sizes, and it's worth watching if you're evaluating premium inventory in Ahmedabad.
For reference, based on the current classification: Affordable housing is priced up to INR 55 lakh; Mid-segment falls between INR 55 lakh and 1.5 crore; High-end spans INR 1.5 to 2.2 crore; and anything above INR 2.2 crore is classified as Luxury.
Developer Spotlight: Savitar Realty
Alongside the launches tracked above, Bopal and the wider West Peripheral corridor (the same belt driving 40% of this quarter's citywide launches) are also where Savitar Realty is building. If you're evaluating options in this high-growth stretch of Ahmedabad, it's worth adding to your shortlist alongside the projects listed in this report.
Economic Indicators Shaping Ahmedabad's Housing Market
Real estate doesn't move in isolation: broader economic conditions set the tone for both buyer sentiment and lending costs.
GDP Growth (Q4 FY25-26): 7.80%, reflecting continued economic expansion (Source: MOSPI)
CPI Inflation: 3.93%, staying within a manageable range
External Benchmark Lending Rate (EBLR): 7.90%, which directly influences home loan interest rates (Source: Reserve Bank of India)
NHB Residex (March 2026): 107.3, up year-on-year, confirming the broader appreciation trend captured in this report (Source: NHB Residex)
Strong GDP growth paired with controlled inflation is generally supportive of housing demand: it keeps buyer confidence intact even as lending rates stay relatively firm.
Outlook: What to Expect in the Second Half of 2026
Based on current trends, the short-term outlook for most Ahmedabad submarkets remains stable, with West Peripheral standing out as the one zone flagged for continued upward movement in both capital values and rents. Prime CBD capital values and the NHB Residex are also trending upward.
Practically, this means:
Buyers in West and West Peripheral corridors should expect prices to keep firming up gradually rather than correcting. Waiting it out is unlikely to bring meaningfully lower entry points.
Renters eyeing West Ahmedabad should note that this submarket posted the highest YoY rent growth (10%) in the city.
Investors may find the luxury and high-end segment worth a closer look, given its 4x annual growth in launches and concentration in exactly the corridors seeing the strongest rental and capital appreciation.
Market data and figures referenced in this article are sourced from the Cushman & Wakefield Ahmedabad Residential MarketBeat Report, Q2 2026, based on information collected until 12th June 2026. Figures are subject to periodic revision as new market data becomes available.